




14 Nov 2026
0
Car Depreciation in 2026: The Average New Car Loses 41.8% of Its Value in Five Years
Depreciation is the money your car loses while you own it, and in 2026 it is the biggest cost of owning a car — bigger than fuel, insurance, or maintenance. The average new car loses 41.8% of its value in the first five years, an average of $16,571, according to iSeeCars’ 2026 depreciation study, which analyzed more than 950,000 five-year-old cars sold between March 2025 and February 2026.
Put it another way: buy a new car today, and on an average day of ownership it quietly loses about $9 in value. AAA’s Your Driving Costs 2026 study puts depreciation at $4,422 a year — the single largest cost of owning a new car, well ahead of fuel ($2,598 a year) and insurance ($2,098), and the one cost most buyers never look at before signing.
The good news is that depreciation is not random. It follows a curve you can see in advance, it hits some cars far harder than others — the worst car in the study lost 63.1% while the best lost just 9.6% — and there are proven ways to make sure someone else takes the biggest hit instead of you. This guide walks through the numbers: how much a car loses each year, which cars depreciate the most and the least, why electric cars fall fastest, and how to use the curve instead of being used by it.
Car depreciation at a glance: five-year losses by type
Not every vehicle loses value at the same speed. Trucks and hybrids hold their value best in 2026; electric vehicles lose the most, by a wide margin.
| Vehicle type | 5-year depreciation | Average $ lost |
|---|---|---|
| Trucks | 34.2% | $12,975 |
| Hybrids | 35.4% | $13,010 |
| All vehicles (average) | 41.8% | $16,571 |
| SUVs (all sizes) | 44.9% | — |
| Small SUVs | 41.7% | $13,855 |
| Midsize SUVs | 47.0% | $20,820 |
| Large SUVs | 52.1% | $36,057 |
| Electric vehicles | 57.2% | $28,435 |
Source: iSeeCars 5-Year Depreciation Study, 2026 edition. Dollar figures compare each vehicle’s original MSRP (adjusted to 2026 dollars) with its average five-year-old selling price.
Two things stand out. First, size costs you: a large SUV loses over half its value, while a small SUV loses about two-fifths. Second, the gap between the best and worst types — trucks at 34.2% versus EVs at 57.2% — is worth real money. On a $45,000 purchase, that gap alone is more than $10,000 over five years.
What is car depreciation?
Depreciation is the difference between what you pay for a car and what it is worth when you sell or trade it in. What is left is called the residual value. If you buy a car for $40,000 and it is worth $23,280 five years later, it has depreciated 41.8% and kept a residual value of 58.2%.
There are two ways to measure the loss, and confusing them leads people astray:
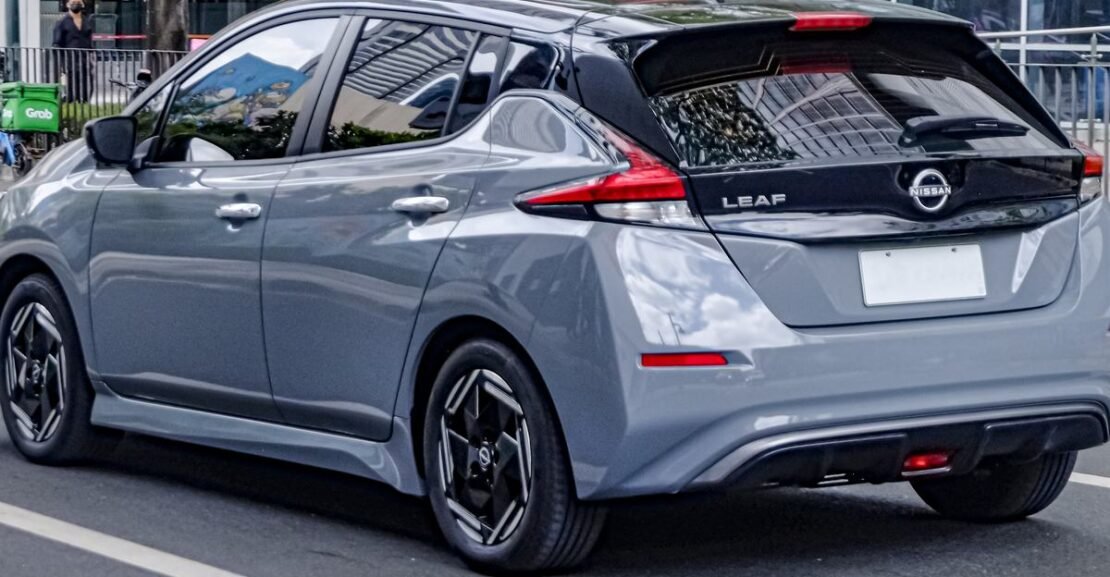
- Percentage loss tells you how much of the car’s price evaporated. The Nissan Leaf is the worst in America by this measure, down 63.1% in five years.
- Dollar loss tells you how much money actually left your pocket. The Land Rover Range Rover loses a smaller percentage (61.7%) but a far bigger pile of cash — $69,856 — because it starts so expensive.
For a buyer on a budget, the dollar loss is the one that matters. For a used-car shopper, the percentage loss is a treasure map: the cars that punish their first owners most are the cheapest to buy at five years old. We will come back to that.
Depreciation is also not the same as wear. A car does not lose 41.8% because it is worn out at five years — most modern cars are just getting started. It loses value because the market pays a premium for new: the warranty is longest, the technology is current, the financing is cheapest, and no one else has owned it. Once those things fade, the price falls to match.
How much does a car depreciate each year?
Depreciation is front-loaded. The first year is the steepest, and the curve flattens as the car ages. Kelley Blue Book’s depreciation schedule breaks the average new car’s loss down year by year:
| Year | Value lost that year | Total value lost | Value remaining |
|---|---|---|---|
| Year 1 | 16% | 16% | 84% |
| Year 2 | 12% | 28% | 72% |
| Year 3 | 11% | 39% | 61% |
| Year 4 | 9% | 48% | 52% |
| Year 5 | 7% | 55% | 45% |
Source: Kelley Blue Book average new-car depreciation schedule, expressed as a share of the original price.
Read it as a story: roughly 28–30% gone in the first two years, the loss slowing every year after. That shape is why the classic advice works — buy a car at two or three years old, and the first owner has already absorbed the worst of it.
Why do KBB and iSeeCars give different five-year numbers — 55% versus 41.8%? Because they measure different things. KBB’s schedule is a rule-of-thumb model built from its own valuation data. iSeeCars measured what actually happened: the real MSRPs and real selling prices of 950,000+ five-year-old cars that changed hands in 2025–26. Cars have held their value unusually well since the pandemic-era shortages, which is why the observed loss (41.8%) now runs below the old rule of thumb (about 55%). AAA’s modeled figure lands near KBB’s: its $4,422 a year works out to about 56% of its $39,376 average new-car price over five years. The honest summary: expect somewhere between roughly 40% and 55% over five years depending on the car, with the exact model mattering far more than the average.
The 10 cars that depreciate the most
These are the ten fastest-falling cars in iSeeCars’ 2026 study — the ones whose first owners lost the largest share of what they paid.
| Rank | Model | Type | 5-year loss | Average $ lost |
|---|---|---|---|---|
| 1 | Nissan Leaf | EV | 63.1% | $17,743 |
| 2 | INFINITI QX80 | Large SUV | 62.8% | $52,631 |
| 3 | Volkswagen ID.4 | EV | 62.1% | $28,010 |
| 4 | Tesla Model S | EV sedan | 62.0% | $58,907 |
| 5 | Land Rover Range Rover | Luxury SUV | 61.7% | $69,856 |
| 6 | BMW 7 Series | Luxury sedan | 61.6% | $61,141 |
| 7 | Tesla Model X | EV SUV | 61.2% | $61,216 |
| 8 | Ford Mustang Mach-E | EV | 60.8% | $22,976 |
| 9 | BMW 5 Series (hybrid) | Hybrid sedan | 59.5% | $44,921 |
| 10 | INFINITI QX60 | SUV | 58.3% | $30,099 |
Source: iSeeCars 2026. Overall, electric and luxury models account for 24 of the 25 worst-depreciating cars in the study.
A closer look at the five worst:
Nissan Leaf — down 63.1% ($17,743)
Why it loses value: the Leaf is older EV technology — modest range by 2026 standards — in a market that keeps getting better batteries for the same money. Why consider it anyway: that collapse is exactly what makes a used Leaf one of the cheapest ways into electric driving. Best for: a second owner who wants a low-cost commuter and lets the first owner take the hit. Our guide to the best used electric cars under $25,000 shows how far a budget stretches when depreciation has done its work.
INFINITI QX80 — down 62.8% ($52,631)
Why it loses value: big luxury SUVs carry big sticker prices, thirst, and expensive upkeep, and the QX80 was replaced by an all-new generation for 2025 — a redesign makes the old model look dated overnight. What to consider: more than $52,000 gone in five years is the price of a whole second car. Best for: used buyers who want flagship size and luxury for a fraction of the original price.
Volkswagen ID.4 — down 62.1% ($28,010)
Why it loses value: early-build software and charging speeds fell behind fast-moving rivals, and heavy new-car discounting pulled used values down with it. What to consider: as a new buy, the discount has to be deep to offset the curve. Best for: used buyers — a five-year-old ID.4 is a lot of electric SUV for the money.
Tesla Model S — down 62.0% ($58,907)
Why it loses value: Tesla’s repeated new-car price cuts reset used prices every time they landed, and luxury EV buyers always want the newest battery and software. What to consider: nearly $59,000 of loss buys a lot of gasoline — or a whole cheapest new car twice over. Best for: used buyers who want flagship EV performance without the flagship bill.
Land Rover Range Rover — down 61.7% ($69,856)
Why it loses value: the biggest dollar loss in the entire study. High starting prices, costly repairs out of warranty, and a well-known reliability reputation — the very factors we rank in our most reliable car brands guide — weigh heavily on resale. What to consider: percentage-wise it is only fifth-worst; in dollars, nothing else comes close. Best for: used buyers with a healthy repair budget who understand what they are getting into.
The 10 cars that hold their value best
At the other end of the table, the pattern is just as clear: sports cars with loyal followings, Toyota trucks, and sensible Toyotas and Hondas barely lose value at all.
| Rank | Model | Type | 5-year loss | Average $ lost |
|---|---|---|---|---|
| 1 | Porsche 718 Cayman | Sports car | 9.6% | $6,988 |
| 2 | Porsche 911 | Sports car | 11.1% | $15,533 |
| 3 | Chevrolet Corvette | Sports car | 18.7% | $13,365 |
| 4 | Toyota Tacoma | Truck | 19.9% | $6,426 |
| 5 | Toyota Tundra | Truck | 21.2% | $8,746 |
| 6 | Honda Civic | Sedan/hatchback | 22.9% | $5,828 |
| 7 | Subaru BRZ | Sports car | 23.7% | $8,489 |
| 8 | Toyota GR Supra | Sports car | 24.0% | $13,963 |
| 9 | Toyota RAV4 / RAV4 Hybrid | SUV/hybrid | 25.2% | $7,731 |
| 10 | Toyota Corolla Hatchback | Hatchback | 25.5% | $6,220 |
Source: iSeeCars 2026. Toyota takes 10 of the top 25 places overall — no other brand is close.
Three lessons hide in this list. First, scarcity and desirability protect value: Porsche sells fewer Caymans and 911s than buyers want, so used prices stay strong. Second, trucks are value shelters — the Tacoma loses just $6,426 in five years, well under half the average car’s $16,571 loss, and even the worst-depreciating truck in the study, the Chevrolet Silverado 1500 at 39.7%, beat the overall average. Third, boring is beautiful: the Civic and Corolla Hatchback are cheap to buy, cheap to run, trusted to last, and easy to resell — the exact combination the used market pays for.
Hybrids deserve a special mention here. The best hybrid in the study, the Toyota RAV4 Hybrid, lost just 25.3% — nearly matching its gas RAV4 sibling — and the Toyota Sienna (28.5%), Corolla Hybrid (30.1%) and Prius (32.1%) all beat the overall average comfortably.
Why electric cars depreciate fastest — and why hybrids flipped
Electric vehicles lose 57.2% of their value in five years, more than 15 points worse than the overall average. As iSeeCars executive analyst Karl Brauer puts it, “electric vehicles continue to lose more value than any other segment, outpacing the industry average by more than 15 percentage points.” Four forces drive it:
- The technology moves fast. A five-year-old EV competes against new models with more range and faster charging for similar money. Buyers discount the old car accordingly.
- New-car price cuts drag used prices down. When a manufacturer cuts the price of the new version, every used example is worth less the same morning — Tesla’s cuts did this repeatedly to the Model S and Model X.
- The tax credit distorted prices. While the $7,500 federal credit existed, eligible new EVs effectively sold below sticker, and used prices had to compete with that. The credit ended on September 30, 2025, and the pricing reset is still working through the used market.
- Battery questions linger. Shoppers still worry about battery degradation and replacement cost, even though modern packs carry long warranties — and worry shows up as lower offers.
The flip side is one of the study’s best stories. In iSeeCars’ 2019 study, hybrids lost 56.7% in five years — among the worst results of any segment. In the 2026 study, hybrids lost just 35.4%, second only to trucks. Hybrids stopped being a compromise and became the default choice for buyers who want fuel savings without charging, range, or battery anxiety — and the used market now pays up for them. Even the best EV, the Tesla Model 3 at 54.6%, lost more than the average hybrid. If resale value is high on your list, the powertrain ranking in 2026 is clear: truck and hybrid at the top, electric at the bottom.
What makes a car depreciate faster?
Whatever you buy, these are the factors that decide how steep your curve is:
- The new-car premium itself. The first year is always the worst (about 16% on KBB’s schedule), because a car stops being “new” the day it is titled to you.
- Mileage. The studies assume roughly average use. Pile on miles well beyond 12,000–15,000 a year and your car is worth less than the same car with fewer miles; drive far less and it is worth more.
- Condition and records. Accidents on the history report, worn tires, deferred maintenance, and missing service records all come straight off the price. A folder of receipts is worth money at resale time.
- A redesign. When an all-new generation lands, the old one looks dated overnight — the QX80’s 62.8% loss is what that looks like in numbers. Buying in the last year before a redesign means buying the steepest part of the curve.
- Manufacturer incentives and price cuts. Heavy discounting on the new version reprices every used one. If a car is always on sale new, it will never be worth much used.
- Reliability reputation. Brands buyers trust to reach 200,000 miles hold value; brands with expensive-repair reputations fall. This is the same math behind our reliable brands ranking.
- Fuel prices and fashion. When gasoline is expensive, thirsty trucks and SUVs sag and hybrids spike; when fuel is cheap, the reverse. You cannot control this one — but knowing it explains why the same truck can be a bargain one year and bid up the next.
- Fleet and rental history. Models sold in bulk to rental fleets flood the used market a few years later, pushing prices down for every owner of that model.
The real cost: depreciation inside your total cost of ownership
Depreciation is easy to ignore because no bill ever arrives for it. But stack it against the costs you do see, and it dwarfs them. In AAA’s Your Driving Costs 2026 study, the average new car costs $12,863 a year to own — and depreciation’s $4,422 is the largest single piece, about a third of the entire bill, ahead of fuel ($2,598), insurance ($2,098) and maintenance, repair and tires ($1,760). We break the full stack down in our guide to the average cost of owning a car in 2026.
Here is the same idea at one car’s scale. Take a $45,000 purchase and apply each segment’s five-year loss from the iSeeCars study:
| $45,000 car | 5-year loss | Worth after 5 years |
|---|---|---|
| Hybrid (35.4%) | $15,930 | $29,070 |
| Average car (41.8%) | $18,810 | $26,190 |
| Electric vehicle (57.2%) | $25,740 | $19,260 |
Same price, same five years — and the EV owner has lost $9,810 more than the hybrid owner. That is the whole game: you choose your depreciation on the day you choose the car, not the day you sell it. It is also why depreciation belongs in every price comparison, right next to the average car prices themselves.
Depreciation and your car loan: the negative-equity trap
Depreciation turns dangerous when a loan is attached. You are underwater — in negative equity — when you owe more on the loan than the car is worth. Because the car falls fastest in year one while the loan balance falls slowly, a small down payment and a long term can put you underwater almost immediately.
An illustration, using a $40,000 car, a 72-month loan at 7% APR, and KBB’s schedule (84% of value left after year one, so the car is worth $33,600):
- Nothing down: you finance $40,000 (about $682 a month). After 12 payments you still owe roughly $34,400 — about $850 more than the car is worth, and that is before sales tax and fees, which most buyers roll into the loan too.
- 10% down ($4,000): you finance $36,000 (about $614 a month). After 12 payments you owe roughly $31,000 — about $2,600 ahead of the car’s value.
That gap is why the down payment matters more than the monthly payment. It is also why rolling an old loan’s shortfall into a new loan — a common dealer offer — is so costly: the shortfall does not vanish, it gets added to the new loan, and you pay interest on a car you no longer own. Our auto loan calculator guide shows how to run these numbers before you sign, our car financing guide covers terms and down payments in depth, and if you are already carrying negative equity on a tight budget, read our bad credit car loans guide before rolling anything forward.
GAP insurance exists for exactly this hole: it pays the difference between your loan balance and the car’s insured value if the car is totaled. It is cheap and worth it when you put little down or take a long term. With 20% down and a term of 60 months or less, most buyers are ahead of the curve from day one and can skip it.
How to beat car depreciation
You cannot stop a car from losing value, but you can choose how much of the loss lands on you:
- Let the first owner take the hit. Buy at two to three years old, after roughly 28–39% of the value is already gone, with warranty life usually remaining. This is the single most effective move — someone else eats the steepest part of the curve.
- Or buy new and keep it a long time. Hold a new car eight to ten years and the painful early loss is spread so thin it stops mattering. Depreciation only truly hurts when you sell early.
- Choose the model, not just the deal. A few hundred dollars off a fast-depreciating car is a bad trade against thousands saved by picking a slow one. Trucks, hybrids, and Toyota/Honda staples are the value shelters in the 2026 data.
- Put real money down and keep the term short. Aim for 20% down and 60 months or less, so your loan balance stays below the car’s falling value.
- Mind the redesign calendar. A model in its final year before an all-new replacement will fall harder. Either wait for the new one or demand a discount that pays you for the drop.
- Protect the car’s story. Service records, clean condition, no accident history, sensible mileage. At resale, two identical cars can be thousands apart on paperwork and condition alone.
- Do not expect leasing to save you. A lease payment is mostly the depreciation for the steepest years of the car’s life, plus interest and fees — you are renting the worst part of the curve. Our lease vs buy guide runs that comparison in full.
The exception: when depreciation is your friend
Everything above flips if you are the second owner. The study’s worst list is the used market’s best list: a five-year-old Leaf at about 37% of its original price, a Mach-E or ID.4 with roughly 60% of its value already gone, a Range Rover that has shed nearly $70,000 — these are the bargains, provided you buy the car’s remaining life (battery warranty on EVs, repair budget on luxury models) with your eyes open. Our best used electric cars under $25,000 guide is built on exactly this trade.
One honest limit: nothing in the mainstream market reliably gains value. Even the best car in the study, the Porsche 718 Cayman, lost 9.6%. Genuine appreciation is collector-car territory — limited runs, low miles, and luck — not a strategy for a car you drive every day.
Frequently asked questions
How much does a car depreciate per year?
It is front-loaded, not even. On Kelley Blue Book’s schedule, the average new car loses about 16% in year one, then 12%, 11%, 9% and 7% in the years after. Measured across the real market, iSeeCars found an average five-year loss of 41.8% — roughly 8% a year on average, but with the biggest drops early.
How much value does a car lose in the first year?
Plan on roughly 15–20% in the first year. KBB’s schedule puts it at 16%; its own FAQ rounds the hit for many models to “20% or more.” There is no separate magic cliff the moment you leave the lot — the loss happens because the car becomes a used car, and it accrues over that first year.
How much does a car depreciate in the first three years?
About 39% on KBB’s year-by-year schedule (16% + 12% + 11%). That is why a three-year-old car is the sweet spot for used buyers: the steepest losses are behind it, and factory warranty coverage often remains.
Which cars depreciate the least?
Sports cars and Toyota trucks. The Porsche 718 Cayman lost just 9.6% in five years, the Porsche 911 lost 11.1%, and the Chevrolet Corvette 18.7%. The Toyota Tacoma (19.9%) and Tundra (21.2%) are the strongest mainstream picks, with the Honda Civic (22.9%) close behind.
Which cars depreciate the most?
The Nissan Leaf, down 63.1% in five years, followed by the INFINITI QX80 (62.8%) and Volkswagen ID.4 (62.1%). The worst list is dominated by electric vehicles and luxury models — 24 of the worst 25 are one or the other.
Do electric cars depreciate faster than gas cars?
Yes — by a lot. EVs lost an average of 57.2% over five years in iSeeCars’ 2026 study, against 41.8% for vehicles overall. iSeeCars does not publish a gas-only split, but the best EV in the study (Tesla Model 3, 54.6%) still lost more than the average vehicle, and hybrids (35.4%) now hold value far better than EVs.
Is it better to buy a two-year-old car or a new one?
On pure math, the two-year-old car usually wins: roughly 28% of its value is already gone, someone else paid for it, and warranty coverage typically remains. Buying new makes sense if you will keep the car eight to ten years, value the full warranty and latest safety tech, or need a model that barely depreciates (a Tacoma loses so little that used prices can be uncomfortably close to new).
Do I need GAP insurance if I put 20% down?
Usually not. With 20% down and a loan term of 60 months or less, you start with equity and your balance stays below the car’s value for most buyers. GAP earns its keep with small down payments, 72–84-month terms, or when you roll negative equity from a previous loan into the new one.
Can I do anything to slow my car’s depreciation?
You cannot stop it, but you can shave it: keep mileage sensible, follow the maintenance schedule and keep the receipts, fix small damage, avoid smoking or pet damage to the interior, and keep the accident history clean. At sale time, condition and paperwork are the part of the curve fully in your control.
Bottom line
The average new car loses 41.8% of its value — $16,571 — in five years, and depreciation is the largest single cost of owning it. But the average hides a spread from 9.6% to 63.1%, and that spread is decided by choices you control: which model you buy, whether you buy new or two years old, how much you put down, and how long you keep it. Run the depreciation numbers before you fall for the monthly payment, and the curve works for you instead of against you.
Sources & Pricing Note
Depreciation figures come from iSeeCars’ 5-Year Depreciation Study (2026 edition), which analyzed 950,000+ five-year-old cars sold from March 2025 to February 2026, comparing original MSRP (adjusted to 2026 dollars) with average five-year-old selling prices; heavy-duty trucks and vans, discontinued models and low-volume models were excluded, so some vehicles do not appear. Ownership-cost figures come from AAA Your Driving Costs 2026 (released September 15, 2026), a modeled five-year/75,000-mile study — a different method from iSeeCars’ observed market data, which is why the two sources’ totals differ. The year-by-year curve is Kelley Blue Book’s depreciation schedule. Worked examples are illustrations: they apply the studies’ published averages to round prices, and the loan example assumes a 7% APR — your rate, mileage, condition and local market will move your actual numbers. Always check a specific car’s current value before buying or selling.
Last updated: November 2026
About the Author
Written by William, founder and editor of MotorAmaze. William covers car prices, ownership costs and buying strategy for US and UK readers, with every figure in this guide checked against the study or source it came from. Read more about MotorAmaze.