
Car Insurance by State: What Drivers Pay in All 50 States (2026)
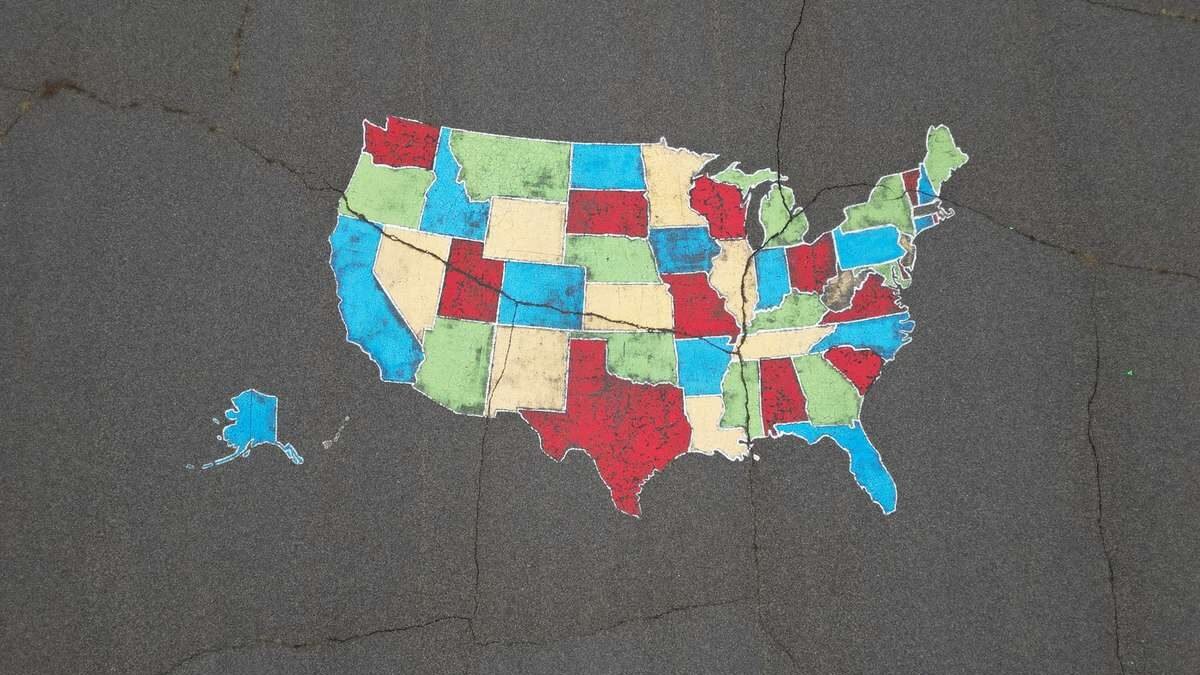
The average American driver pays $208 a month ($2,496 a year) for full coverage car insurance in 2026, according to ValuePenguin’s 2026 State of Auto Insurance Report. But that national number hides a huge gap. The cheapest and priciest states sit $207 a month apart. A driver in Vermont pays about $128 a month. The same coverage in Nevada costs about $335 a month — $2,484 more every year, for the same car and the same driver.
There is good news. After years of painful double-digit hikes, rates are finally steadying: prices are expected to rise by less than 1% (0.67%) in 2026, the smallest year-over-year increase since 2022. Your state still sets the floor for what you pay, though. This guide gives you the 2026 average for every state and Washington, D.C. It also explains why your state costs what it does, and how to cut your own bill — wherever you live.
The Cheapest States for Car Insurance in 2026
Vermont is the cheapest state to insure a car in 2026, at $128 a month for full coverage — 38% below the national average. The five cheapest states are all rural, low-density states with fewer crashes, less theft, and lower repair and medical costs.
| Rank | State | Full coverage / month | Full coverage / year | vs. national average |
|---|---|---|---|---|
| 1 | Vermont | $128 | $1,536 | −38% |
| 2 | Maine | $129 | $1,548 | −38% |
| 3 | Wyoming | $131 | $1,572 | −37% |
| 4 | New Hampshire | $134 | $1,608 | −36% |
| 5 | North Carolina | $147 | $1,764 | −30% |
| 6 | Ohio | $148 | $1,776 | −29% |
| 7 | Idaho | $148 | $1,776 | −29% |
| 8 | Hawaii | $151 | $1,812 | −27% |
| 9 | Indiana | $166 | $1,992 | −20% |
| 10 | Wisconsin | $168 | $2,016 | −19% |
Why this is good news: if you live in one of these states, full coverage is genuinely affordable. The gap between minimum liability and full coverage is often under $100 a month, so protecting your own car costs little extra. What to consider: cheap-state averages still hide wide gaps by city. A driver in downtown Columbus pays far more than one in rural Ohio, and your age, record, and credit score still move your quote more than your state does.
The Most Expensive States for Car Insurance in 2026
Nevada is the most expensive state in 2026, at $335 a month for full coverage — 61% above the national average. Drivers in the ten priciest states pay more than 2.5 times as much as drivers in the cheapest states.
| Rank | State | Full coverage / month | Full coverage / year | vs. national average |
|---|---|---|---|---|
| 1 | Nevada | $335 | $4,020 | +61% |
| 2 | Louisiana | $327 | $3,924 | +57% |
| 3 | Florida | $311 | $3,732 | +50% |
| 4 | Connecticut | $305 | $3,660 | +47% |
| 5 | Delaware | $302 | $3,624 | +45% |
| 6 | Rhode Island | $276 | $3,312 | +33% |
| 7 | Colorado | $272 | $3,264 | +31% |
| 8 | Michigan | $260 | $3,120 | +25% |
| 9 | New Jersey | $249 | $2,988 | +20% |
| 10 | Texas | $247 | $2,964 | +19% |
Why it costs so much: these states share the same expensive mix — dense traffic, high crash and theft rates, costly litigation, severe weather, and a large share of uninsured drivers. One note on the top spot: other studies rank Louisiana first (Bankrate, February 2026). Which state is #1 depends on the driver profile studied. But Nevada, Louisiana, and Florida sit in the top three in every major study. What to consider: the state average is not your quote. Comparing three or more insurers matters most exactly where averages are highest, because the spread between the cheapest and priciest insurer in the same ZIP code can top $1,000 a year.
Average Car Insurance Cost by State: The Full 2026 Table
Every figure in this table is the average monthly premium for full coverage in 2026. All of them come from the same ValuePenguin dataset, so the states compare fairly. Full coverage means liability plus collision and comprehensive, for a driver with a clean record and good credit. Your own quote will differ — see why quotes differ so much below.
| State | Full coverage / month | Full coverage / year | vs. national average ($208/mo) |
|---|---|---|---|
| Alabama | $181 | $2,172 | −13% |
| Alaska | $170 | $2,040 | −18% |
| Arizona | $236 | $2,832 | +14% |
| Arkansas | $225 | $2,700 | +8% |
| California | $221 | $2,652 | +6% |
| Colorado | $272 | $3,264 | +31% |
| Connecticut | $305 | $3,660 | +47% |
| Delaware | $302 | $3,624 | +45% |
| Florida | $311 | $3,732 | +50% |
| Georgia | $184 | $2,208 | −11% |
| Hawaii | $151 | $1,812 | −27% |
| Idaho | $148 | $1,776 | −29% |
| Illinois | $185 | $2,220 | −11% |
| Indiana | $166 | $1,992 | −20% |
| Iowa | $170 | $2,040 | −18% |
| Kansas | $225 | $2,700 | +8% |
| Kentucky | $208 | $2,496 | 0% |
| Louisiana | $327 | $3,924 | +57% |
| Maine | $129 | $1,548 | −38% |
| Maryland | $211 | $2,532 | +2% |
| Massachusetts | $181 | $2,172 | −13% |
| Michigan | $260 | $3,120 | +25% |
| Minnesota | $222 | $2,664 | +7% |
| Mississippi | $201 | $2,412 | −3% |
| Missouri | $221 | $2,652 | +7% |
| Montana | $211 | $2,532 | +1% |
| Nebraska | $193 | $2,316 | −7% |
| Nevada | $335 | $4,020 | +61% |
| New Hampshire | $134 | $1,608 | −36% |
| New Jersey | $249 | $2,988 | +20% |
| New Mexico | $212 | $2,544 | +2% |
| New York | $226 | $2,712 | +9% |
| North Carolina | $147 | $1,764 | −30% |
| North Dakota | $180 | $2,160 | −13% |
| Ohio | $148 | $1,776 | −29% |
| Oklahoma | $214 | $2,568 | +3% |
| Oregon | $199 | $2,388 | −4% |
| Pennsylvania | $198 | $2,376 | −5% |
| Rhode Island | $276 | $3,312 | +33% |
| South Carolina | $190 | $2,280 | −9% |
| South Dakota | $196 | $2,352 | −6% |
| Tennessee | $176 | $2,112 | −16% |
| Texas | $247 | $2,964 | +19% |
| Utah | $224 | $2,688 | +8% |
| Vermont | $128 | $1,536 | −38% |
| Virginia | $169 | $2,028 | −19% |
| Washington | $219 | $2,628 | +6% |
| Washington, D.C. | $244 | $2,928 | +17% |
| West Virginia | $179 | $2,148 | −14% |
| Wisconsin | $168 | $2,016 | −19% |
| Wyoming | $131 | $1,572 | −37% |
| U.S. average | $208 | $2,496 | — |
Washington, D.C. is included for comparison, though it is not a state. Annual figures are monthly averages multiplied by 12.
Why Other Sources Show Different Averages
You will see other national averages quoted for 2026 — $2,357 a year (NerdWallet), $2,637 (Bankrate), $2,857 (InsuranceQuotes). The InsuranceQuotes figure is based on rates insurers filed with state regulators as of September 30, 2026. None of them is wrong. Each study uses a different driver profile, a different car, and a different data source — filed rates, quote data, or actual policies sold. The National Association of Insurance Commissioners (NAIC), which measures real policies, put the 2023 combined average premium at $1,438 per vehicle. Treat any average as a benchmark for comparing states, never as a quote. Your price is set by your ZIP code, your car, your record, and your credit — in that order, after your state.
Why Car Insurance Costs So Much More in Some States
Your state sets your premium through five forces. None of them is in your control — but knowing them tells you where the money goes and which levers you can still pull.
1. State law sets the floor
Every state writes its own minimum coverage law, and the minimums vary wildly. California raised its minimums to 30/60/15 on January 1, 2025, under Senate Bill 1107 — the first increase since 1967. That means $30,000 bodily injury per person, $60,000 per accident, and $15,000 property damage. Virginia raised its minimums to 50/100/25 on the same date. Higher legal floors mean higher premiums for everyone in the state, because insurers must pay more per claim.
2. No-fault rules and PIP
Twelve states run no-fault systems: Florida, Hawaii, Kansas, Kentucky, Massachusetts, Michigan, Minnesota, New Jersey, New York, North Dakota, Pennsylvania, and Utah. In these states, your own Personal Injury Protection (PIP) pays your medical bills, no matter who caused the crash. Kentucky, New Jersey, and Pennsylvania are “choice no-fault” states, where drivers can elect a tort option. No-fault states tend to cost more. PIP pays out fast and often, and medical costs keep rising. Michigan is the extreme case. Its old unlimited-PIP system kept it near the top of every price ranking for years. The 2019 reform (effective July 2, 2020) finally let drivers choose capped PIP levels.
3. Uninsured drivers raise everyone’s bill
About 15.4% of American drivers had no insurance in 2023, up from 11.6% in 2019, according to the Insurance Research Council. The worst states are Mississippi (28.2%), New Mexico (24.1%), Michigan (22.3%), and Florida (20.6%) — roughly one in five Florida drivers is uninsured, up from about 16% in 2022. Maine, the safest state on this measure, sits at 5.7%. When an uninsured driver hits you, your own uninsured-motorist coverage pays — and insurers price that risk into every policy in the state.
4. Weather, theft, and traffic density
Hurricanes in Florida and Louisiana, and hail in Colorado and Texas, push claim frequency and severity up. So does the dense urban traffic in Connecticut, New Jersey, and New York. Rural states with long, empty roads — Vermont, Maine, Wyoming, Idaho — have fewer crashes per mile driven, fewer thefts, and cheaper repairs. Population density alone explains much of the gap between the top and bottom of the table.
5. Litigation and fraud
Louisiana and Florida are famous in the industry for lawsuit frequency and staged-accident fraud, and their premiums show it. States where injury claims routinely go to court cost more to insure than states where claims settle quickly. This is also why the cheapest states tend to be the ones where the legal system is quietest.
State Spotlights: The Rules That Change Your Bill
Florida: the most expensive system, not just the most expensive state
Florida’s $311-a-month average is only part of the story. Florida is the only state that does not require bodily injury liability coverage at all. The legal minimum is just $10,000 in PIP and $10,000 in property damage — limits unchanged since the 1970s. That sounds cheap until a serious crash arrives. A single hospital stay can top $60,000. And one in five drivers around you carries no insurance at all. Bills to repeal the no-fault PIP system died again in the 2026 session, so the structure is not changing soon. If you drive in Florida, uninsured/underinsured motorist coverage is not optional in practice — it is the only thing standing between you and the other driver’s empty wallet. Read our step-by-step guide on what to do after a car accident before you need it.
California: minimums doubled in 2025
California’s $221-a-month average looks moderate next to Florida, but the rules changed under drivers’ feet. Senate Bill 1107 raised the minimum liability limits to 30/60/15 on January 1, 2025 — the first increase since 1967 — and the law already schedules another rise to 50/100/25 on January 1, 2035. If your policy renewed in 2025, your liability limits doubled automatically. Many drivers saw a 5% to 15% rise on the liability part of the premium at renewal. The new floor is still a floor, not a recommendation. After a serious crash, $30,000 per person does not go far — not in a state where the average new car now costs over $50,000.
Virginia: the fee loophole is closed
Virginia used to let drivers pay a $500 annual uninsured-motorist fee instead of buying a policy. That option ended July 1, 2024. Since January 1, 2025, every registered vehicle in Virginia must carry at least 50/100/25 liability coverage. Uninsured/underinsured motorist coverage is required at the same limits. Virginia’s average — $169 a month, 19% below the national average — is still cheap by national standards, but the days of legally driving uninsured in the state are over.
Michigan: choice finally exists, but the price is still high
Michigan’s 2019 reform lets drivers pick their PIP medical level. The choices are unlimited, $500,000, $250,000, or $50,000 for some Medicaid enrollees. Drivers with qualifying health coverage, such as Medicare, can opt out in full. The Michigan Catastrophic Claims Association assessment for 2026–27 is $84 per vehicle for unlimited PIP and $19 for capped tiers. Even so, Michigan’s $260-a-month average remains 25% above the national average. Medical costs and litigation in the state are still among the highest in the country.
New Hampshire: the one exception
New Hampshire is the only state that does not require car insurance. Drivers must still prove financial responsibility after a crash — and if you cause one without coverage, you pay out of pocket and can lose your license. Almost every New Hampshire driver buys insurance anyway, and the state still has the fourth-cheapest average in the country at $134 a month. The lesson is not “skip insurance.” It is that a small, rural, low-crash state can be cheap even without a mandate.
Vermont and Ohio: cheap for a reason, not by accident
Vermont ($128) and Ohio ($148) top the cheap list for the same boring reasons: low population density, fewer uninsured drivers, modest litigation, and cheap repair costs. Ohio is one of the cheapest states in the country — and, by the InsuranceQuotes filed-rates benchmark, the cheapest state outright at $1,638 a year. If you live there, the cheapest full coverage in America is already yours. Your job is to keep it that way, with a clean record and a regular quote comparison.
Minimum Coverage vs. Full Coverage by State
Full coverage is a shorthand, not a policy type: liability plus collision and comprehensive. Minimum coverage is liability only, at your state’s legal floor. It is much cheaper — but it pays nothing toward your own car.
| State | Minimum coverage / month | Full coverage / month | The gap |
|---|---|---|---|
| Wyoming | $30 | $131 | $101 |
| Vermont | $40 | $128 | $88 |
| Maine | $47 | $129 | $82 |
| Louisiana | $101 | $327 | $226 |
| Florida | $102 | $311 | $209 |
| Nevada | $164 | $335 | $171 |
Source: ValuePenguin, July 2026. In the cheap states, the step up from minimum to full coverage costs $82–$101 a month. In Louisiana it costs $226. The national average for minimum coverage alone is about $682 a year (Bankrate, February 2026).
Why buy full coverage? If your car is financed or leased, your lender requires it — no choice. If you own your car outright, use the 10% rule: when collision and comprehensive cost more than 10% of your car’s value per year, dropping them is worth considering. What to consider: minimum coverage is a legal floor, not a safety net. Say you hit a new car. Its average transaction price is $51,109 (Kelley Blue Book, October 2026). A $10,000 property-damage limit — Florida’s legal minimum — does not come close to replacing it. The cost of the problem is the gap between your limits and the real bill, and that gap comes out of your savings.
Worked Example: The Same Driver Moves From Florida to Ohio
Take one driver: 40 years old, clean record, good credit, a 2024 Toyota Camry, full coverage with a $500 deductible. Only the state changes.
| Florida | Ohio | |
|---|---|---|
| Full coverage / month | $311 | $148 |
| Full coverage / year | $3,732 | $1,776 |
| 5-year full-coverage total | $18,660 | $8,880 |
The move saves $163 a month and $1,956 a year — $9,780 over five years — for identical coverage on an identical car. The gap alone is larger than an Ohio driver’s entire annual insurance bill ($1,776).
Now put that in the context of owning a car. AAA’s Your Driving Costs 2026 puts the total cost of owning and running a car at $12,863 a year. Insurance is $1,704 of that for a gas medium sedan ($2,070 for an EV), and depreciation is $4,422. So insurance is roughly 13% of what a car costs you each year. And your state can swing that slice by more than $1,900. Our full breakdown is in The Average Cost of Owning a Car in 2026. If the car itself is losing value fast, also read Car Depreciation in 2026: How Much Value Your Car Loses before you decide how much coverage it deserves.
How to Choose the Right Coverage for Your State
Start with your state’s minimums, then buy past them. The legal minimum is written for the state’s budget, not yours. A 100/300/100 liability policy — $100,000 per person, $300,000 per accident, $100,000 property damage — is the standard recommendation from consumer advocates. It usually costs only a little more than the minimum. Best for: anyone with savings, a house, or income worth protecting.
Match PIP and UM/UIM to your state’s risks. In a no-fault state, PIP is mandatory — check the limit, because Florida’s $10,000 is thin. In a high-uninsured state (Mississippi, New Mexico, Michigan, Florida, California), uninsured/underinsured motorist coverage is the most valuable line on your policy. Best for: drivers in the ten most expensive states and the five highest-uninsured states.
Fit the deductible to your emergency fund. A $1,000 deductible instead of $500 cuts your premium. It also stops you filing small claims that raise your rate later. But it only works if you can actually pay $1,000 after a crash. Best for: drivers with at least $1,000 set aside.
Check the lender’s rules before you buy the car. Financed and leased cars require full coverage, and some lenders set a maximum deductible. That is a real cost of financing. Our How to Finance a Car in 2026 guide walks through it. If your credit is weak, also read Bad Credit Car Loans: How to Get Approved in 2026. Credit-based insurance scores mean a low credit score raises your premium too. ValuePenguin found poor credit raises rates by 95% compared with good credit.
7 Ways to Lower Your Car Insurance Rate in Any State
- Compare at least three quotes every year. Insurers price the same driver hundreds of dollars apart in the same ZIP code. A member of Clark Howard’s own team saved $480 a year just by re-shopping. Start with our guide to getting the cheapest car insurance quotes.
- Raise your deductible to $1,000. It is the fastest single cut to a premium — as long as you can cover the deductible from savings.
- Ask about telematics. A usage-based program that tracks your driving can cut up to 30% for safe, low-mileage drivers. But it can also raise your rate if you brake hard and drive late at night. Read the terms first.
- Bundle home and auto. One insurer for both policies usually saves 10% to 20%, and it is the easiest discount to get.
- Fix your credit. In most states, insurers use a credit-based insurance score. ValuePenguin’s finding — poor credit costs 95% more than good credit — makes this the biggest long-term lever after your driving record. (California, Hawaii, Massachusetts, Michigan, and Washington ban or heavily restrict the practice.)
- Drop collision and comprehensive on an old car. Use the 10% rule above. If your car is worth $3,000 and full coverage costs $400 a year for those two lines alone, you are paying to insure a car you could replace.
- Buy a cheaper car to insure. Insurers price by claim history, not sticker price. Before your next purchase, check insurance costs for the models on your list. Our Cheapest New Cars Under $25,000 in 2026 is a good starting point. The average new-car price guide shows what you are really paying for the car itself.
Frequently Asked Questions
The questions below are the ones drivers ask most about car insurance by state — each answered with the 2026 number, not a guess.
What state has the cheapest car insurance?
Vermont, at $128 a month ($1,536 a year) for full coverage in 2026, according to ValuePenguin. Maine ($129), Wyoming ($131), and New Hampshire ($134) follow.
What state has the most expensive car insurance?
Nevada, at $335 a month ($4,020 a year) for full coverage in 2026 — 61% above the national average — in ValuePenguin’s data. Louisiana ($327), Florida ($311), Connecticut ($305), and Delaware ($302) complete the top five. (Bankrate’s February 2026 study ranks Louisiana first. The top spot varies by driver profile, but the same three states lead every major study.)
What is the national average cost of car insurance in 2026?
About $208 a month ($2,496 a year) for full coverage, per ValuePenguin’s 2026 report. Other studies put it between $2,357 and $2,857 a year because they use different driver profiles and data. Minimum liability coverage averages about $682 a year (Bankrate).
Why is car insurance so expensive in Florida?
Four reasons stack up. Florida is a no-fault state with mandatory $10,000 PIP. It is the only state that does not require bodily injury liability. About one in five drivers (20.6%) is uninsured. And the state has high litigation, fraud, and hurricane exposure. The $10,000 minimums have not changed since the 1970s.
Does moving to another state change my car insurance rate?
Yes — immediately, and by a lot. Insurers re-rate your policy for the new state’s laws, crash rates, and repair costs. The same driver and car cost $3,732 a year in Florida and $1,776 in Ohio in 2026: a $1,956-a-year difference. Tell your insurer before you move; your old policy does not automatically follow you.
Do I need full coverage?
You need it if your car is financed or leased — your lender requires it. If you own the car outright, it is your call: full coverage pays to repair or replace your own car, while liability-only pays only the other driver’s losses. Use the 10% rule — if collision and comprehensive cost more than 10% of your car’s value per year, dropping them is worth considering.
What is the minimum car insurance required in my state?
It varies by state. California requires 30/60/15 since January 1, 2025. Virginia requires 50/100/25 since the same date. Florida requires only $10,000 PIP and $10,000 property damage. New Hampshire requires none. After a DUI or a license suspension, many states also require an SR-22 filing — a form your insurer sends the state to prove you carry at least the minimum. Check your state department of insurance for the current figures — minimums changed in several states in 2025, and older articles still show the old numbers.
How much is car insurance for a 22-year-old?
About $4,184 a year for full coverage on their own policy, according to Bankrate (November 2025 rates). That is roughly 59% above Bankrate’s own national average of $2,637 a year for an experienced driver. Rates fall fast with age: the same Bankrate data puts a 23-year-old at $3,937. Young drivers should compare quotes even more aggressively, since insurers price young drivers further apart than anyone else.
Bottom Line
Your state is the single biggest factor in your car insurance bill that you did not choose. Vermont drivers pay $128 a month for full coverage; Nevada drivers pay $335. The gap is written in state law, crash statistics, weather, and courtrooms — not in your driving. What you can control is everything after that. Compare three quotes every year. Carry more than the legal minimum. Set a deductible you can actually pay. And re-shop the day anything changes — a move, a new car, a birthday, a credit-score jump. The average hides the truth. That is what a car insurance by state comparison is for: your state’s number is the one that matters, and now you know it.
Sources & Pricing Note
Figures in this guide come from ValuePenguin’s 2026 State of Auto Insurance Report (national average and all 51 state averages; updated July 2026, via Clark.com). They are cross-checked against InsuranceQuotes (rates insurers filed with state regulators as of September 30, 2026) and Bankrate’s February 2026 study. Uninsured-driver rates are from the Insurance Research Council (2023), via the Insurance Information Institute. State law details: California Senate Bill 1107 (California Vehicle Code § 16056), Virginia Code § 46.2-472, Michigan’s 2019 no-fault reform and the Michigan Catastrophic Claims Association, and the Florida PIP statute. Ownership-cost figures are from AAA’s Your Driving Costs 2026. Average new-car prices are from Kelley Blue Book (October 2026).
Prices shown are averages for full coverage (liability plus collision and comprehensive) for a driver with a clean record and good credit, unless stated otherwise. They exclude taxes, fees, and your personal rating factors — age, ZIP code, driving record, credit score, and vehicle all move your quote. Averages from different studies disagree because they use different driver profiles and data sources; figures here are benchmarks for comparing states, not quotes. Always get quotes for your own profile and verify your state’s current minimums with its department of insurance before you buy.
Last updated: November 2026
About the Author
Written by William, founder and editor of MotorAmaze. William covers car buying, ownership costs, and insurance for American drivers, with every price checked against primary sources before it goes on the page. Read more about him at MotorAmaze About.
